
Figure 4.
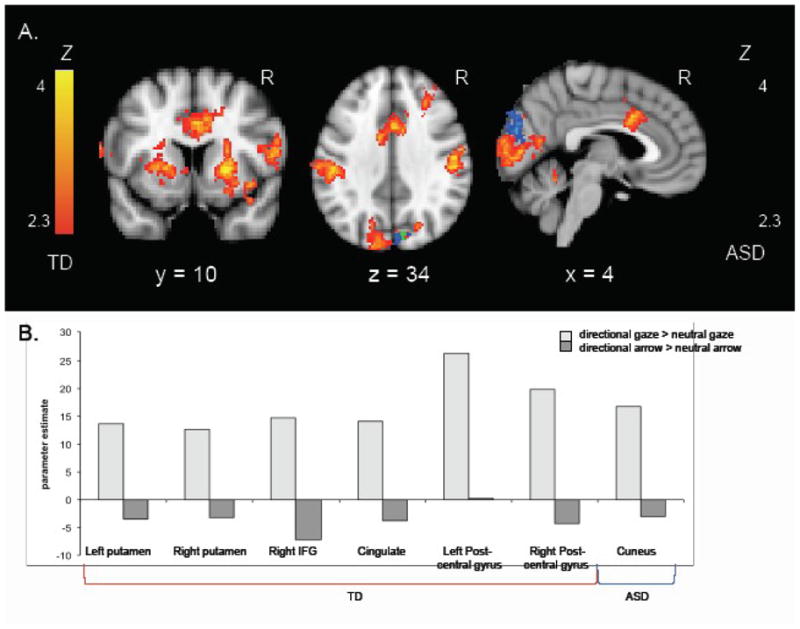
A. Z statistic activation maps of the 2 (Gaze vs. Arrow) × 2 (Directional vs. Neutral) interaction for each group (corrected for multiple comparisons at the cluster level, p < .05). Color barsindicate Z statistic; TD group shown in red-yellow, ASD group shown in blue-light blue, overlap shown in green. Coronal slice shows activity in bilateral putamen, cingulate, and right IFG; transverse slice shows activity in bilateral postcentral gyrus, cuneus, cingulate, and right middle frontal gyrus; sagittal slice shows activity in cingulate and visual cortices. B. Parameter estimates for the directional gaze > neutral gaze and directional arrow > neutral arrow contrasts for regions shown in A.