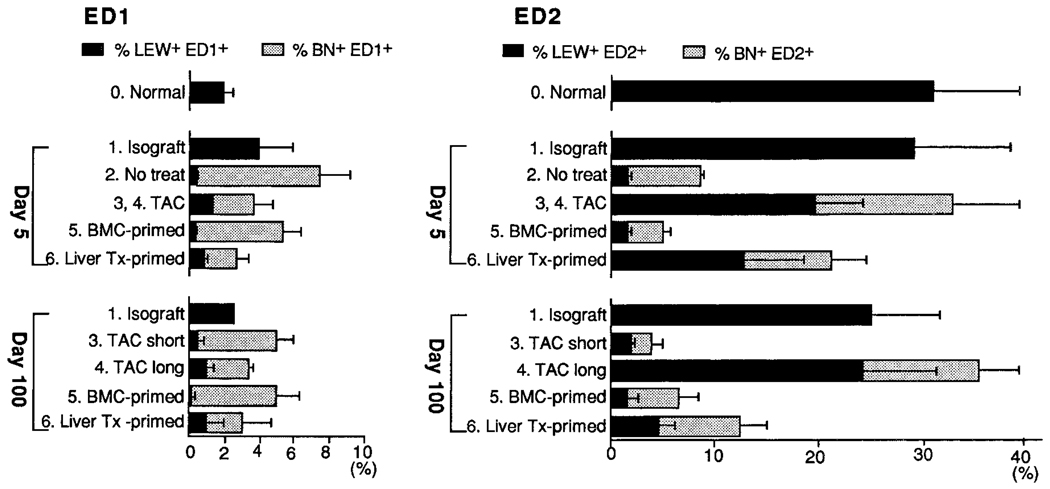
Figure 2.
Flow cytometric analysis of heart-cell suspensions obtained from different experimental groups 5 and 100 days after transplantation (Tx). Subsets of ED1+ and ED2+ macrophages are shown with a breakdown of LEW (donor) and BN (recipient) constituencies. All data are expressed as percentages of CD45+ cells.

