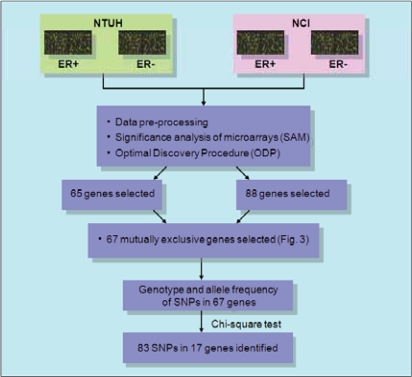
Figure 1.
Flowchart for the gene expression-based comparative analysis. Microarray gene expression data of the NCI dataset (breast cancer patients in the U.K.) and the NTUH dataset (breast cancer patients in Taiwan) were separated into ER+ and ER− groups respectively for further identification of significantly differentially expressed genes through statistical algorithms, Significant Analysis of Microarrays (SAM) and Optimal Discovery Procedure (ODP). 88 genes in the NCI dataset and 65 genes in the NTUH dataset were selected. After mapping these selected genes against the common gene pool between both datasets, 67 mutually exclusive genes were chosen for the SNP analysis. After examining the genotype and allele frequency of these 67 genes using chi-square test (p-value <0.001), 83 SNPs in the 17 genes were identified.

