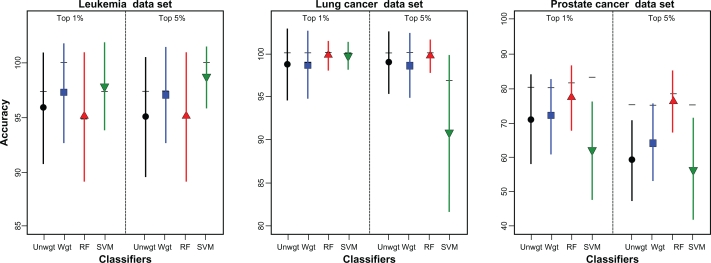
Figure 3.
Comparison of voting classifiers, random forest and SVM. Accuracy (mean ± SE) for unweighted (Unwgt) and weighted (Wgt) voting classifiers, random forest (RF) and support vector machines (SVM) based on 1,000 random training:test set partitions of two gene expression data sets (leukemia, lung cancer) and a proteomics data set (prostate cancer). Features to include in the classifiers were identified through a jackknife procedure through which features were ranked according to their frequency of occurrence in the top 1% or 5% most significant features based on t-statistics across all jackknife samples. Horizontal bars show LOOCV results. Results presented for weighted and unweighted voting classifiers are based on the number of features yielding the highest mean accuracy. For the leukemia data set the 49 or 51 features yielded the highest accuracy for the voting classifiers in the MRV procedure while for LOOCV, the best numbers of features for the unweighted voting classifier were 17 and 11 using the top 1% and 5% of features, respectively and were 13 and 51, respectively for the weighted voting classifier. For the lung cancer data set, 3 and 5 features were best with LOOCV for the weighted and unweighted classifier. Under MRV, 51 features yielded the highest accuracy for the weighted voting classifier while 19 or 39 features needed for the unweighted voting classifier based on the top 1% and 5% of features, respectively. With the prostate cancer data set, the unweighted voting classifier used 31 and 49 features with MRV and 35 and 17 features with LOOCV based on the top 1% and 5% of features, respectively. For the weighted voting classifier, these numbers were 49, 51, 31 and 3, respectively. The number of features used in random forest and SVM varied across the training:test set partitions. Depending on the validation strategy and percentage of features retained in the jackknife procedure, the number of features ranged from 67 to 377 for the leukemia data set, from 233 to 2,692 for the prostate cancer set and from 247 to 1,498 for the lung cancer data set.

