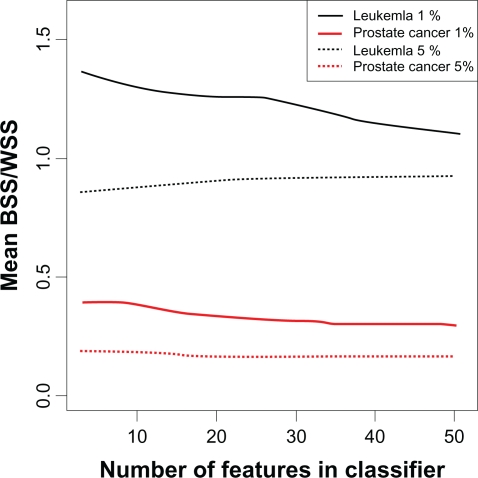
Figure 4.
Mean BSS/WSS of features in voting classifiers. Mean BSS/WSS of features included in the voting classifiers constructed from varying numbers of features for the leukemia and prostate cancer data sets. Mean values were calculated using the training sets from 1,000 random training: test set partitions. Features to include in the classifiers were identified through a jackknife procedure through which features were ranked according to their frequency of occurrence in the top 1% or 5% most significant features based on t-statistics across all jackknife samples.

