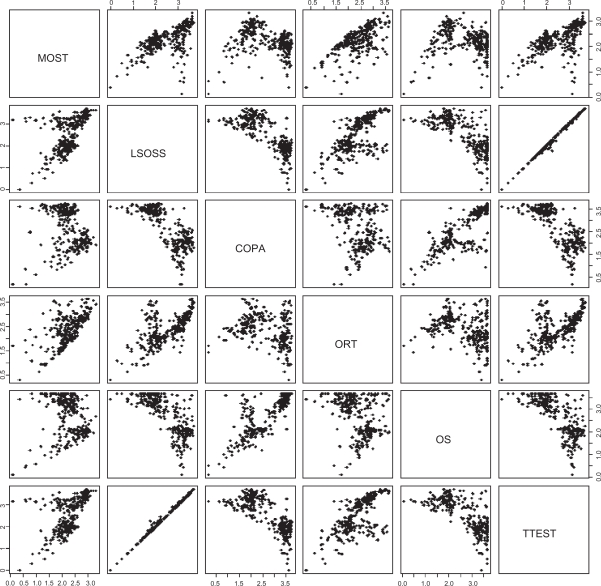
Figure 2.
Pairs plot. The matrix of scatter plots illustrates dependencies between the different outlier measures. The scales of average ranks are again logarithmic, giving more relative emphasis to the top ranks. LSOSS is practically equivalent to t-test, providing for the top ranks exactly the same rank order. Note that a top rank from COPA implies a good rank also from MOST; the same goes for OS and t-test also, so MOST consolidates the sensitivity of several other methods.

