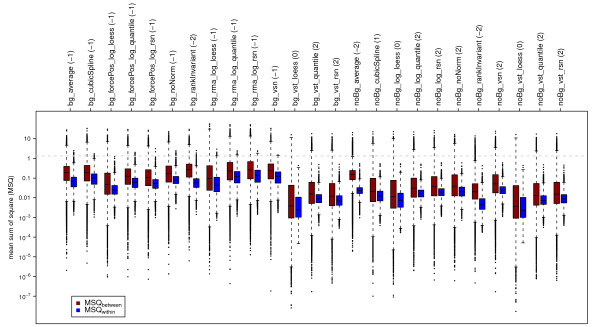
Figure 4.
Boxplots of MSQwithin (blue) and MSQbetween (red). MSQs were calculated based on the gene expression measured for the three sample groups analyzed, namely untreated HaCaT cells after 2, 4, and 12 hours. Results obtained for the different pre-processing methods used are displayed. The grey dashed line indicates the expected value for the MSQbetween of 1.33 based on 6, 6, and 7 as measurements for the group means of four replicates for three time points.

