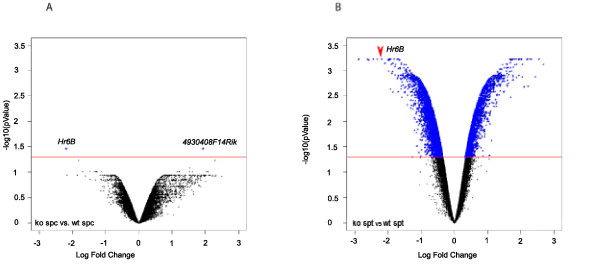
Figure 2.
Volcano plots of p-values (corrected for false discovery) against log2 fold changes. The log2 fold change is displayed on the x-axis and -log10(p-value), representing the probability that the gene is differentially expressed, on the y-axis. The blue labels indicate genes that are differentially expressed, with a p-value > 0.05. Red lines indicate the p-value cutoff point (0.05; -log10(0.05) = 1.30103). A: Plot showing the p-values derived from the comparison between late spermatocytes from wild type (wt) and Hr6b knockout (ko),. Only two differentially expressed genes were found, shown as blue dots. B: Plot showing the p-values derived from the comparison between round spermatids (spt) from wildtype (wt) and Hr6b knockout (ko). All 7289 differentially expressed genes are shown as blue dots.

