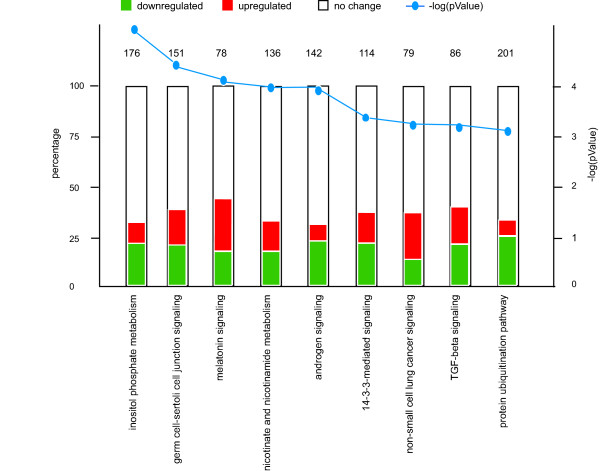
Figure 4.
Pathway analysis. Differentially expressed genes were uploaded to Ingenuity pathways analysis software. The top 9 pathways are displayed, and the full table is available as additional data file 3. The canonical pathways that are involved in this analysis are displayed along the x-axis. On the y-axis, the percentage of genes that are up- or downregulated is represented. Red shows upregulated, green shows downregulated. The number on the bar graph shows the number of known genes in this pathway, e.g. from the 201 genes that are involved in protein ubiquitination 49 are downregulated and 16 are upregulated; the other 136 genes that are involved in this pathway are not uploaded to Ingenuity because they were not differentially expressed, or for other annotation reasons. The blue line shows the -log (p-value), and the scale shown on the right side of the graph.

