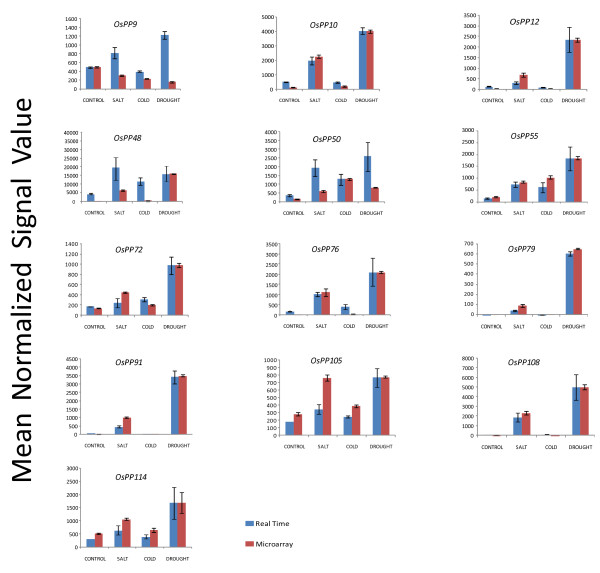
Figure 7.
Validation of expression profiles for selected OsPPs by Q-PCR. Two and three biological replicates were taken for Q-PCR and microarray analysis respectively. Standard error bars have been shown for data obtained using both the techniques. Y-axis represents raw expression values obtained using microarray and Q-PCR expression values normalized with the maximum average value obtained by microarray data and X-axis shows different experimental conditions; red bars represent the expression from microarrays, while blue bars represent the real-time PCR values.

