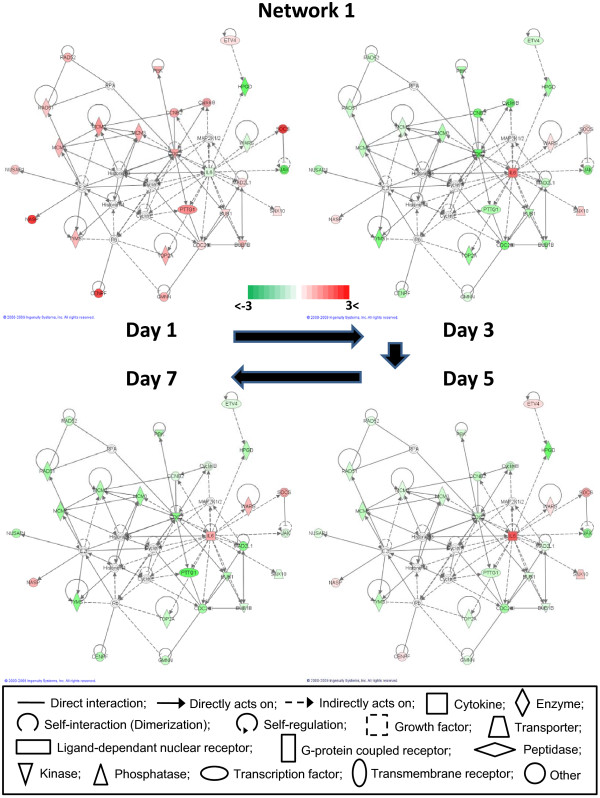
Figure 5.
Network #1 of gene network analysis. Molecular interactions among important focus molecules are displayed at each dpi time points. Green represents down-regulation while red depicts up-regulation. White symbols depict neighboring genes. The intensity of color represents the average of log fold change in a given population. The numbers below the color change bar denote log2 values. Symbols for each molecule are present according to molecular functions and type of interactions.

