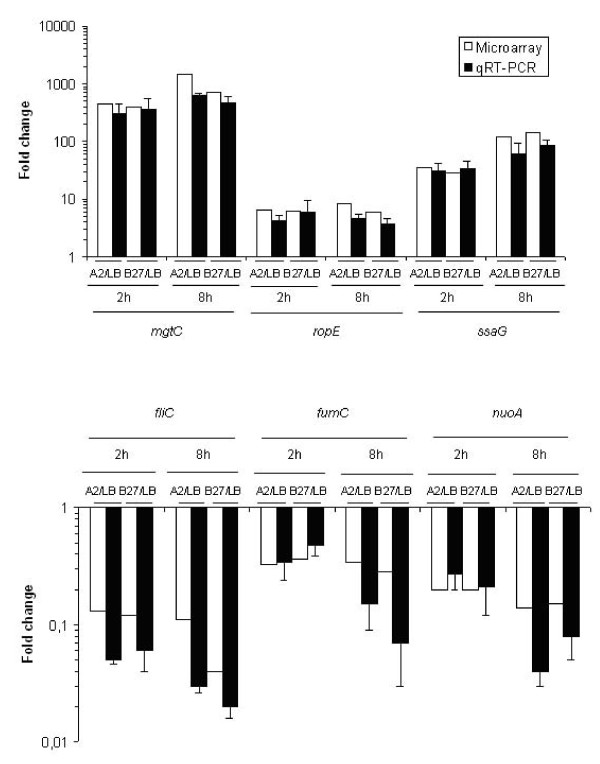
Figure 3.
Validation of microarray results by quantitative real time RT-PCR. The fold changes in gene expression are shown when S. Enteritidis growth in HLA-A2 or HLA-B27 cells was compared to growth in LB broth. The expression levels of selected up-regulated genes (A) or down-regulated genes (B) are shown in logarithmic scale. The experiments were repeated at least three times with similar results. Values are mean numbers ± standard deviations generated from three independent experiments. Correlation coefficients (R) for comparisons of two techniques are: up-regulated genes; 0.977 (A2/LB) and 0.959 (B27/LB), down-regulated genes 0.530 (A2/LB) and 0.620 (B27/LB) (see Additional file 2: Supplemental Table S7).

