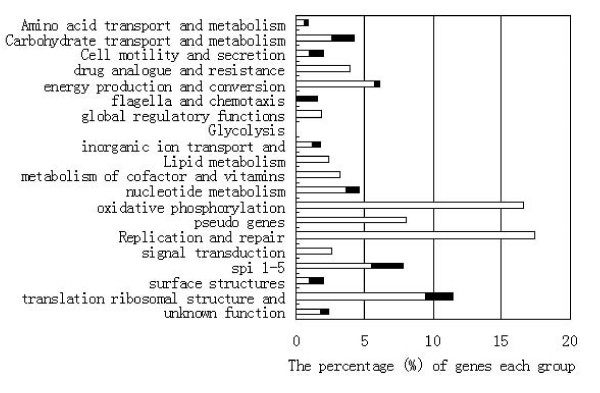
Figure 4.
Differential expression of S. Enteritidis genes between HLA-B27 and HLA-A2 cells divided into functional groups at 8 h time point. Bars indicate percentages of genes in each group that showed significant changes in S. Enteritidis gene expression in HLA-B27 cells compared to in HLA-A2 cells. The white bars indicate the proportion of up-regulated genes and the black bars the percentage of down-regulated genes for each group.

