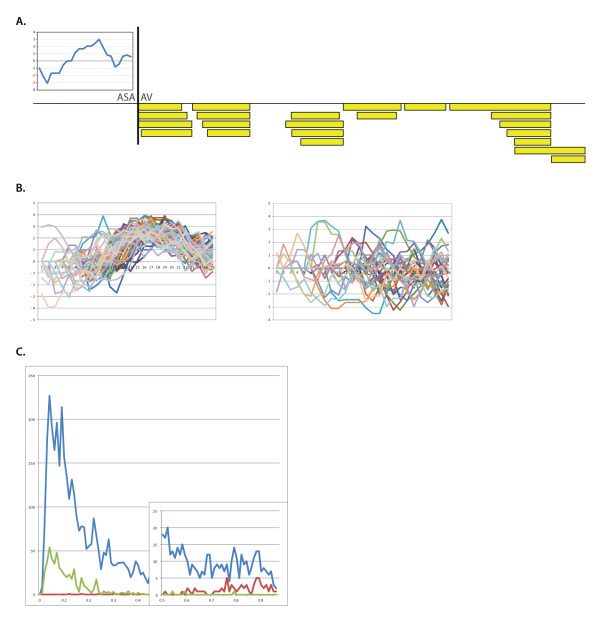
Figure 4.
Signal Peptide Identification. (A) Y. pestis KIM znuA, a periplasmic zinc transporter is shown with the key elements of a signal peptide. The left graph inset is a hydropathy plot showing a stretch of hydrophobic residues (positive values). The cleavage is marked by '|' between ASA (the signal peptidase recognition motif) and AV (the beginning of the mature protein). Peptides observed in our dataset are marked with boxes. (B) Hydropathy plots from putative signal peptides with a hydrophobic patch, and without. Note that for signal peptides with a patch (left) there is a clear preference for the location of the motif - see discussion in the text. (C) Comparison of signalp scores with proteomic observation. The score of all proteins in plotted in blue. The score of proteins confirmed as containing a signal peptide is in red. The score of proteins rejected by proteomics is in green.

