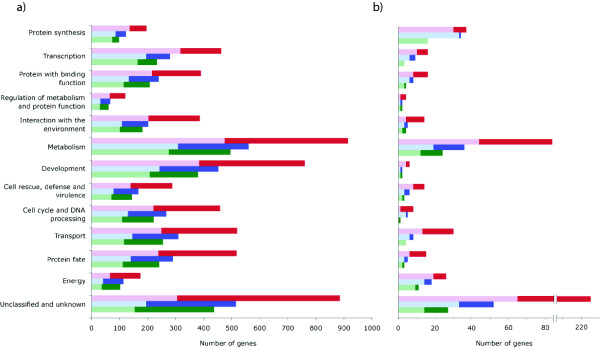
Figure 1.
Functional classification of genes significantly differentially expressed (P ≤ 0.05) by a) S. cerevisiae grown in nitrogen-poor conditions and b) N. crassa protoperithecia identified by transcript profiling using oligo(dT) (red) or multi-targeted primers (blue). Genes identified by both methods marked in green. Light-colored bars represent genes meagerly expressed and dark-colored bars represent genes abundantly expressed. The categories are sorted by the proportion of genes meagerly- to abundantly- expressed.

