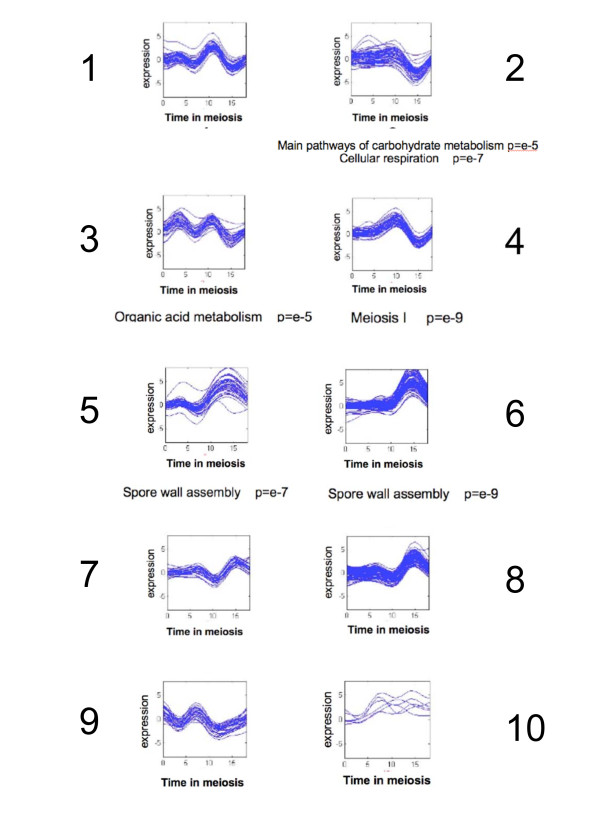
Figure 3.
Clustering of RNA expression analysis in W303 meiosis. K mean clustering results on the de-convoluted W303 expression data (see Methods). The expression values (log2 ratios) along the meiosis are shown for all the genes divided into ten clusters. GO categories enrichments are shown beneath the graphs.

