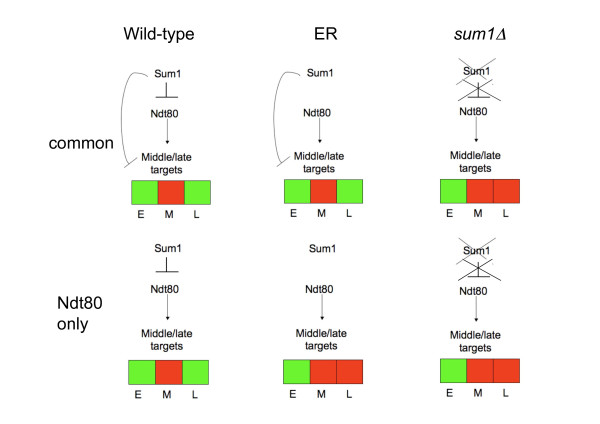
Figure 8.
Model for the regulation of meiotic expression by Ndt80 and Sum1 in different genetic backgrounds. for every genetic background (WT, ER and sum1-deletion), the structure of the feed forward-loop is presented, as is the expected induction and repression pattern of different targets (common and Ndt80-only targets, in rows, red for induction, green for repression) at three time points along the meiosis: E-early, M-middle and L-late.

