
Figure 2.
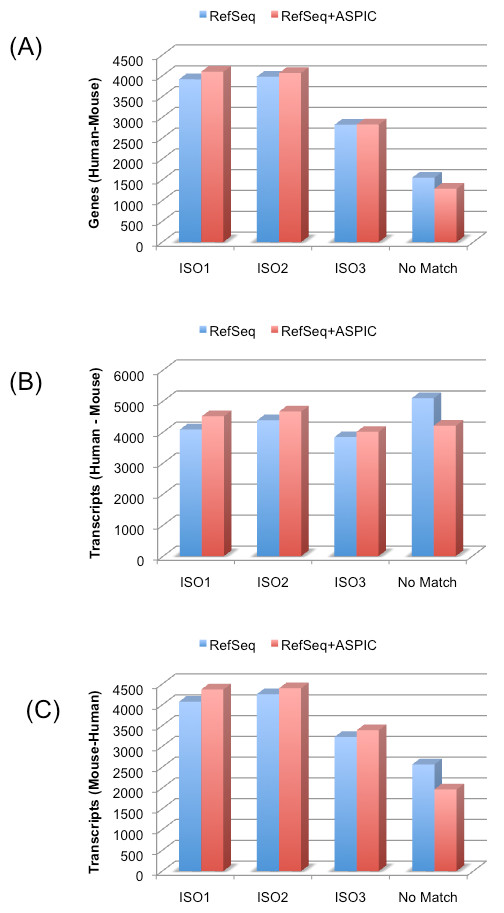
Splicing orthologs in human and mouse. (A) Number of human/mouse orthologous gene pairs with transcript pairs fulfilling the three different criteria of splicing orthology (ISO1, ISO2 and ISO3) or giving no match considering only RefSeq or ResSeq+ASPicDB transcripts. (B) Number of human RefSeq transcripts with an orthologous splicing counterpart in mouse RefSeq (or RefSeq + ASPicDB) transcripts, and (C) vice versa for mouse. Gene structure comparisons have been carried out by Exalign software [26].