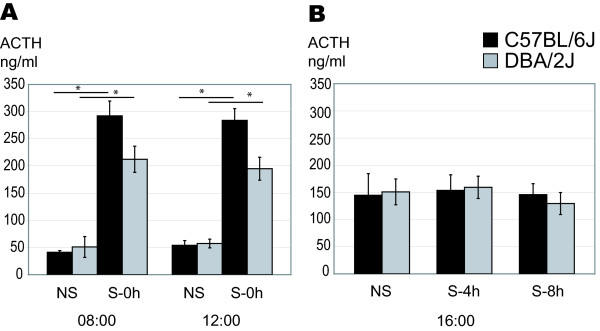
Figure 2.
Plasma ACTH concentrations of stressed and non stressed mice. A. To monitor the ACTH stress response, a group of mice was stressed (S-0 h) and sacrificed immediately thereafter (at 8:00 or at 12:00) in parallel to a control non stressed group (NS). 5 min forced swimming caused an instantaneous induction of ACTH plasma levels in C57BL/6J and DBA/2J mice either at 8:00 or at 12:00; n = 5 for each condition. Data represent mean and SD. B. Plasma ACTH levels of non-stressed (NS) and stressed animals at the time of sacrifice i.e. 4 h and 8 h after stress (S-4 h, S-8 h) were determined and show no significant difference between groups; n = 10 for each condition. Data represent mean and SD. Brains of these animals were saved for microarray analysis.

