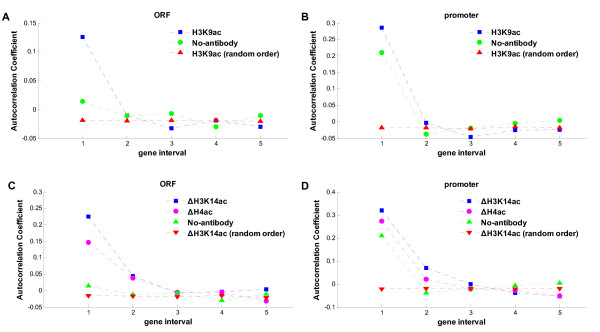
Figure 1.
The mean autocorrelation within 5 gene intervals. The autocorrelation of histone modification was calculated for 50 linked genes. The mean of autocorrelation within 5 gene intervals is shown. The autocorrelation of random order (the order of genes was randomized) and of the control data (no-antibody) are shown as the controls. (A) Mean autocorrelation of H3K9ac in translated regions (ORF). The modification level of a gene was defined as the mean occupancy in its translated region. (B) Mean autocorrelation of H3K9ac in promoter regions. The modification level of a gene was defined as the mean occupancy in its promoter region. (C) Mean autocorrelation of ΔH3K14ac and ΔH4ac in translated regions. (D) Mean autocorrelation of ΔH3K14ac and ΔH4ac in promoter regions.

