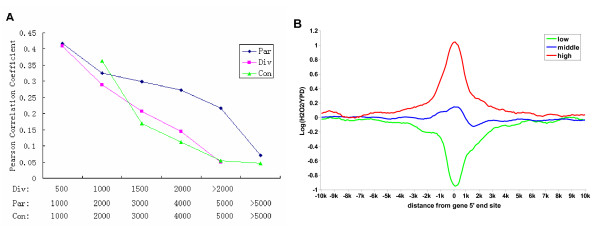
Figure 4.
The relationship between co-modification and gene distance. (A) The correlation of ΔH3K14ac between immediate neighboring genes according to the gene 5' distance. Considering the effect of gene direction, the correlations were plotted according to the directions of pairs: parallel (Par), divergent (Div) and convergent (Con). (B) Composite profiles of ΔH3K14ac according to ΔH3K14ac level of the target gene in the translated region. All genes were assigned to 1 of 3 groups according to mean ΔH3K14ac in the coding regions (low, bottom 20%, middle, middle 60%; and high, top 20%), and aligned by the ORF 5'end start sites. From the start sites, the neighboring regions both upstream and downstream were segmented into 100 bins of 100 bp each by a moving window (size, 100 bp; step, 100 bp). The average ΔH3K14ac in each bin is plotted for each gene group.

