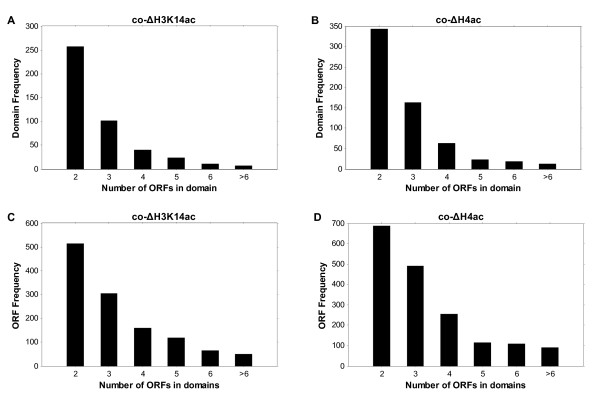
Figure 7.
The size distribution of coacetylation domains that covered at least 1 gene pair. (A) A histogram of domain frequency according to the number of ORFs covered in the H3K14ac domains. (B) A histogram of domain frequency according to the number of ORFs covered in H4ac domains. (C) A histogram of ORF frequency according to the number of ORFs covered in H3K14ac domains. (D) A histogram of ORF frequency according to the number of ORFs covered in H4ac domains.

