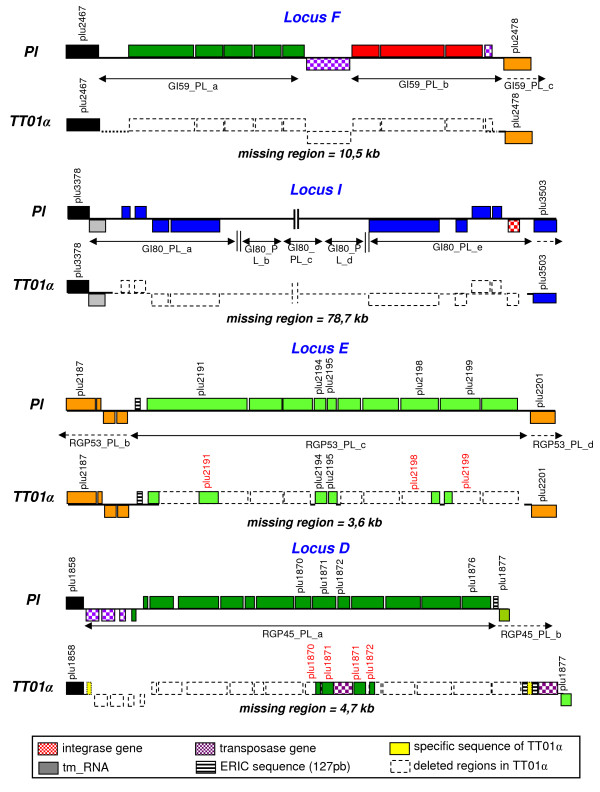
Figure 8.
Schematic genetic map of the F, I, E and D loci in the Pl genome and their counterparts in the TT01α variant genome. The boxes above and below the axis represent ORFs in the forward and reverse orientations, respectively. The putative functions of the ORFs within RGPs are indicated by specific colors (see legend Figure 4). Mobility genes, repeat sequences or specific features are marked with motifs described below the figure. The modules in loci D, E, F and I are indicated, below the axis, by black horizontal double arrows.

