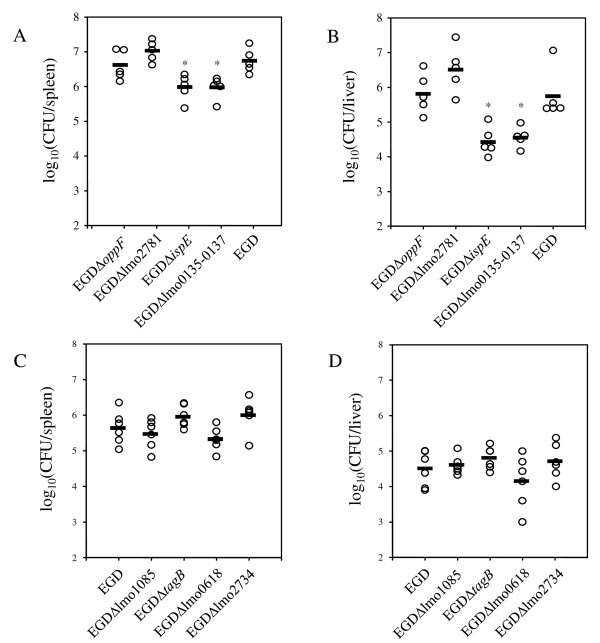
Figure 4.
Virulence of L. monocytogenes mutants in vivo. The bacterial loads of infected mice were determined three days and six days after intravenous infection with a sublethal dose of 2 × 10³ CFU. The numbers of CFU per organ in spleen (A, C) and liver (B, D) of individual mice are shown. Bars indicate the mean values of the experimental groups. Statistical analysis of results was performed with the Tukey multiple comparison test (p < 0.05), and asterisks indicate significantly attenuated mutants. The experimental groups were ranked according to the bacterial load. The experiments were repeated twice with similar results.

