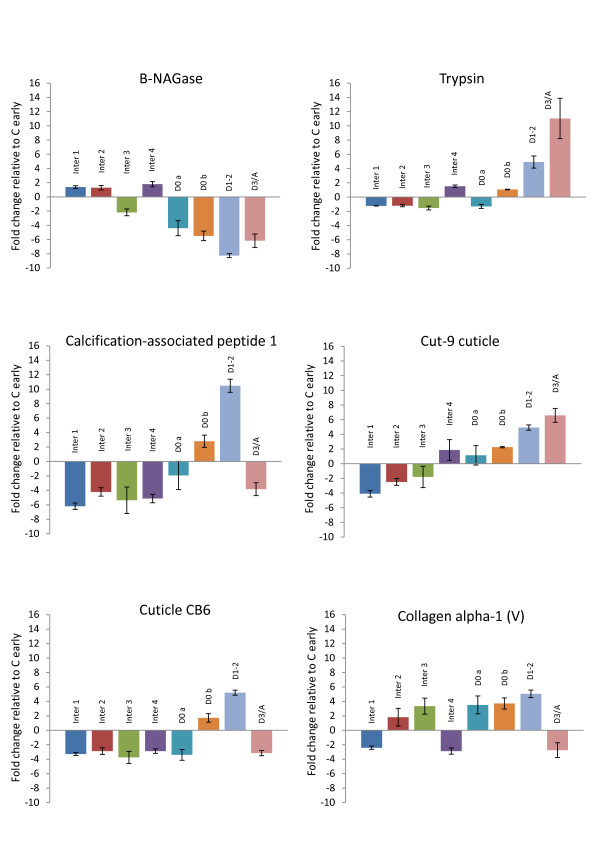
Figure 2.
Expression profiles of genes across the moult cycle relative to the moult cluster groups. Fold change is indicated on the vertical axis. Error bars indicate the standard error of the mean. Quantitative PCR analysis of five of these genes indicated general agreement with the expression patterns shown here (see additional file 2 for details).

