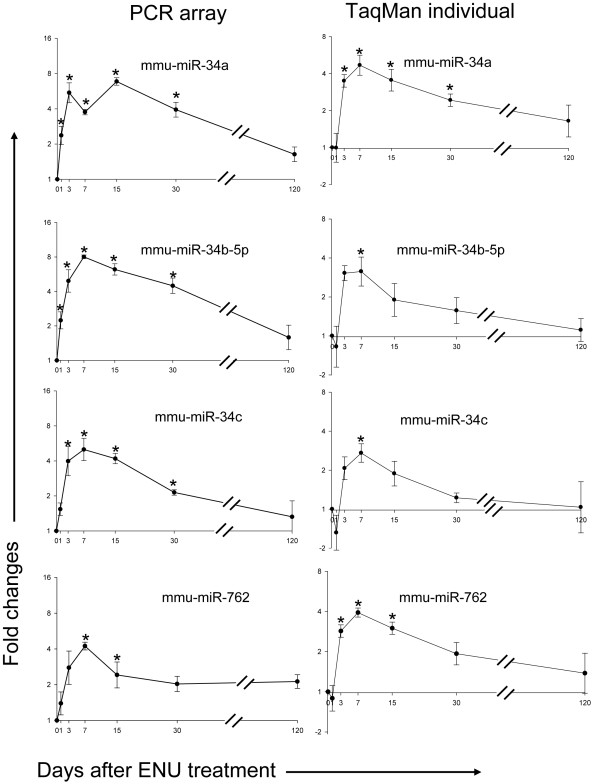
Figure 3.
The temporal expression changes of three miR-34 family members and one miR-762 family member as determined by PCR arrays and individual TaqMan assays. The data for each time point are the mean of 4 or 5 samples with its standard error. The asterisk indicates there is a significant difference between the treatment and control at that time point (p < 0.01).

