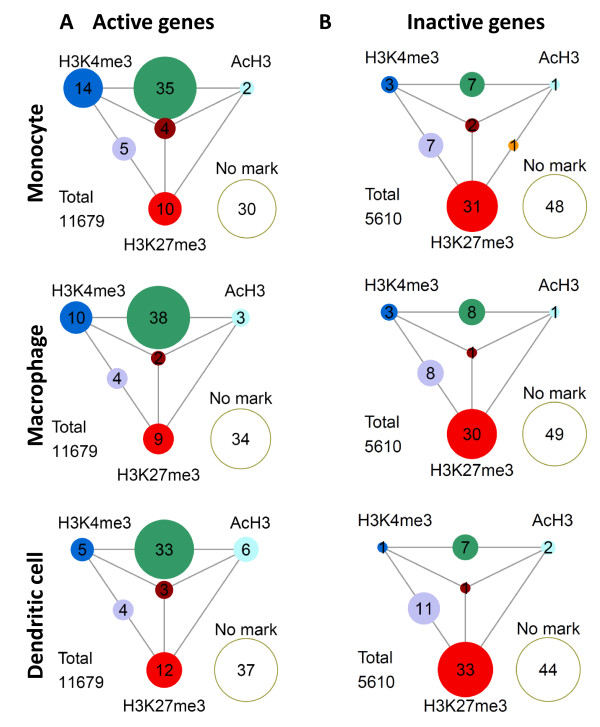
Figure 3.
Frequencies of H3K4me3, AcH3 and H3K27me3 marks and their combinations among (A) transcriptionally active and (B) inactive gene promoters. Frequencies of modifications are shown as percentages in scaled circles positioned to outer corners of the triangles. Frequencies of co-occuring modifications are shown in between. Studied cell types are indicated left. "No mark" represents the lack of histone modifications analyzed in this study.

