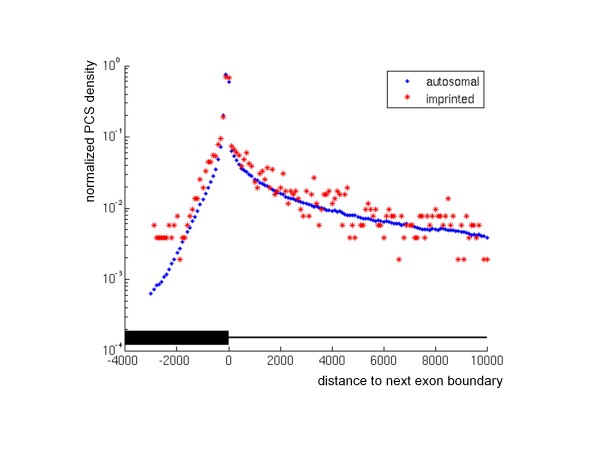
Figure 3.
Distribution of phastCons sequences at exon boundaries. Shown are the frequencies of PCSs in introns and exons as a function of their distance from the closest exon boundary in a semi-logarithmic representation. The y-axis shows the normalized PCS density calculated as the number of PCSs per 100 bp bin divided by the number of introns in the respective group (imprinted, autosomal). On the x-axis, the position of the exon boundary is marked as zero. PCSs with negative distances are either partially or completely located in exons (thick black bar). Most of these are concentrated within a distance of 2000 bp from the exon boundary. Likewise, the number of PCSs that are completely located in introns (thin black line; positive distances) decreases rapidly within increasing distance. Beyond a distance of 10 kb (not shown here), only a few PCSs are found. Imprinted genes (red stars) possess more PCSs within about ± 2000 bp of the exon boundary than autosomal genes (blue diamonds).

