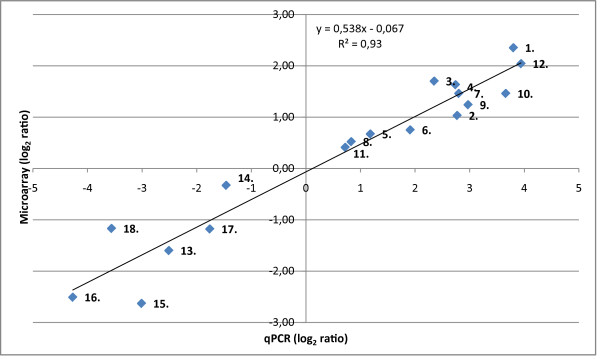
Figure 1.
qPCR validation of microarray results. Mean log2 ratios of qPCR results, based on all the included serotypes, are plotted against the mean log2 ratios of the microarray analysis. Included are twelve up-regulated and six down-regulated genes representing a range of log2 ratio values. The numbers on the graph refer to genes listed in Table 4.

