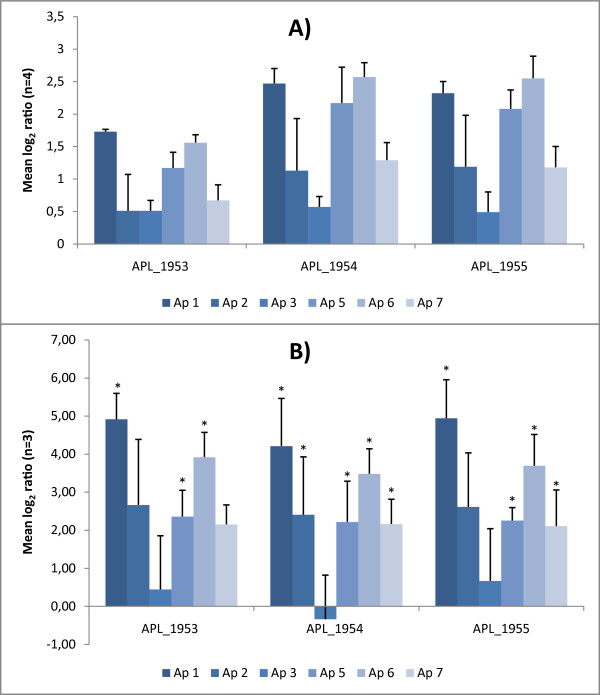
Figure 5.
Serotype specific transcriptional up-regulation in response to iron depletion. Individual mean log2 expression ratios for the three hpuB ORFs, APL_1953 to APL_1955 in the six included A. pleuropneumoniae serotypes: (A) obtained with microarray analysis, (B) obtained with qPCR analysis. Hinges represent the 95% confidence intervals. The asterisks indicate statistical significant up-regulation (P < 0.05) as determined by simple statistical randomization test in REST [71].

