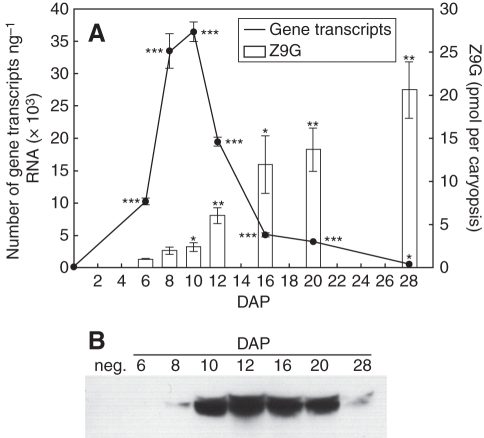
Fig. 8.
Quantitative analysis of ZmCNGT transcript abundance and the amount of Z9G in caryopsis from 0 to 28 DAP (A) and immunoblotting analysis of ZmCNGT protein from 6 to 28 DAP; 50 µg of protein was loaded per lane (B). Values in (A) represent the mean ± s.e. of nine reactions for quantification of transcript, and of three independent cytokinin extractions for Z9G quantification. Asterisks indicate significant differences between the transcript or Z9G abundance at 0 DAP and other time points: *P < 0·05, **P < 0·01, ***P < 0·001.

