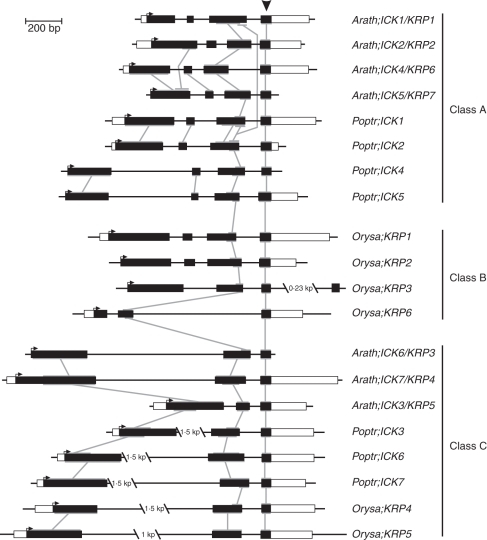
Fig. 2.
Exon–intron organization of the ICK/KRP genes from arabidopsis, rice and poplar. Exons and introns are represented by boxes and black lines, respectively. White boxes, when full-length cDNA sequences are known, correspond to untranslated regions. The genes are drawn to scale and are aligned by the most conserved exon in all genes (indicated by an arrowhead). Horizontal arrows indicate start codons. Interconnected grey lines correspond to related regions in exons. Sequences are organized according to the phylogenetic classes.

