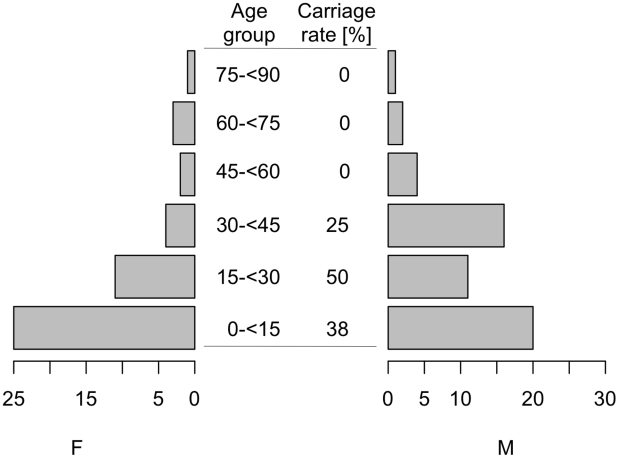
Figure 1. Pagoda-shaped population pyramid of the study population and S. aureus carriage rates (%) in different age groups.
X-axis indicates the percentage of male (M) and female (F) participants of the whole study population, y-axis represents age groups and the carriage rate of S. aureus in the respective age group.

