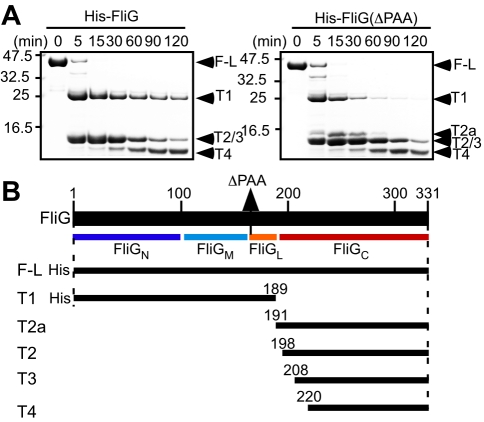
Figure 2. Conformation of FliG in solution.
(A) Protease sensitivity of His-FliG (left panel) and His-FliG(ΔPAA) (right panel). Arrowheads indicate intact molecule and proteolytic products on SDS-PAGE gels with labels corresponding to those in the diagram shown in (B). (B) Proteolytic fragments identified by MALDI-TOF mass spectroscopy and N-terminal amino acid sequencing.

