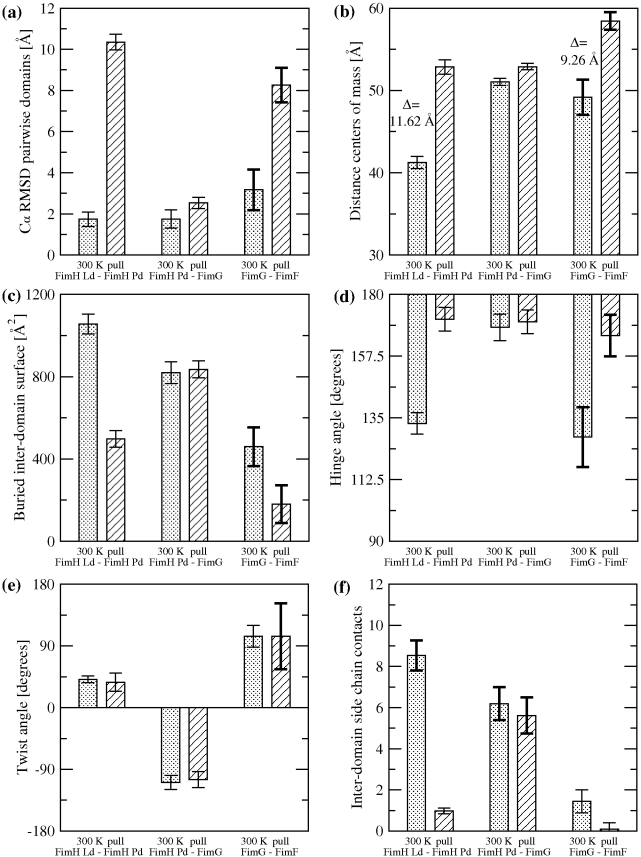
Figure 4. Quantitative data from MD simulations.
Bars filled with dots indicate averages of quantities measured during the 300 K simulations, while bars with angular hatching indicate averages from the last 2 ns of pulling runs. Error bars show standard deviations (SD). To highlight quantities with large SD, the error bar is thicker if the SD is larger than the average of all SDs of a given quantity. (a) Cα RMSD of pairwise adjacent domains. (b) Distance between the centers of mass of two adjacent domains. (c) Surface area buried between two adjacent domains. (d) Hinge and (e) twist angle between two adjacent domains, respectively. (f) Number of native side-chain contacts between two adjacent domains.

