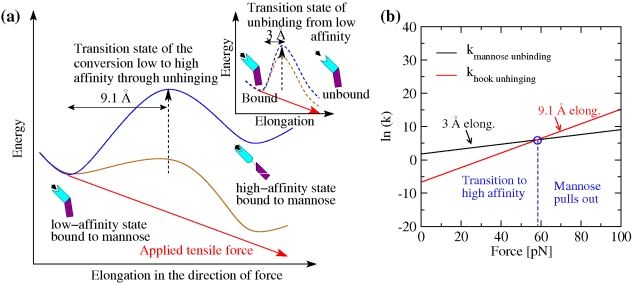
Figure 6. Effect of force on dissociation kinetics versus unhinging and activation kinetics.
(a) Schematic representation of the energy landscape of FimH bound to mannose in the absence of force (blue) and in the presence of an external tensile force (brown). The energy barrier for the unhinging conversion from the low- to the high-affinity state is represented as solid lines. The barrier of the mannose unbinding process from the low-affinity state is shown in the insert as dashed lines. The energy added to the system as a result of the applied tensile force is indicated by a red line. The energy landscape in the presence of force is a result of the superposition of the energy landscape in the absence of force and the product of force times elongation. The elongation between the native and transition states is indicated. (b) Representation of the slopes for the rate constants for unhinging and unbinding. Since the elongation until conversion to the high-affinity state is not known, the slopes are calculated for the lower limit, 8.5 Å, and the upper limit, 18 Å, of the range. The intersection between the slopes for the unhinging rate and the slope for the mannose unbinding rate are indicated by blue circles. Where the slopes intersect the rate of unbinding and the rate of unhinging is equal.

