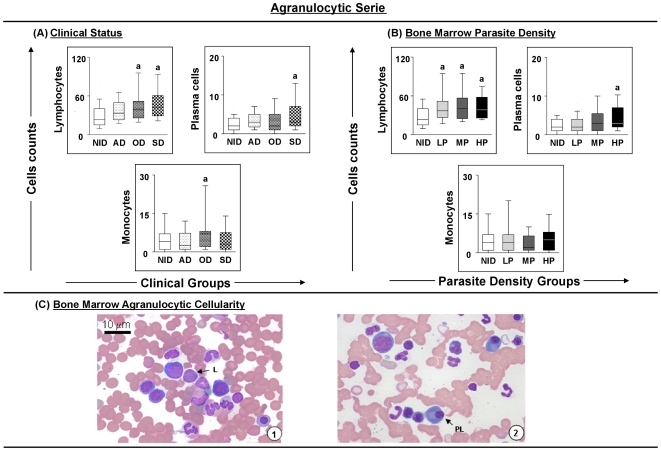
Figure 4. Profiles of the agranulocytic cell series in dogs naturally infected with Leishmania chagasi.
Panel A - animals categorised according to their clinical status into asymptomatic (AD = white boxes with small points), oligosymptomatic (OD = white boxes with large points), symptomatic (SD = white boxes with squares) or non-infected (NID = white boxes) groups. Panel B - animals categorised according to bone marrow parasite density into low (LP = gray boxes), medium (MP = dark gray boxes) and high (HP = black boxes) parasite density and non-infected (NID = white boxes) groups. Absolute cell counts are presented in a box-plot format, the median, maximum and minimum values represents the interquartile range. Significant differences (p<0.05) with respect to the NID group are indicated by the letter ‘a’. Panel C - cellularity of the agranulocytic series observed in the bone marrow of dogs assessed in this study. Slides were stained with Giemsa; bar = 10 µm. L indicates lymphocyte; PC, plasma cell; M, monocyte.

