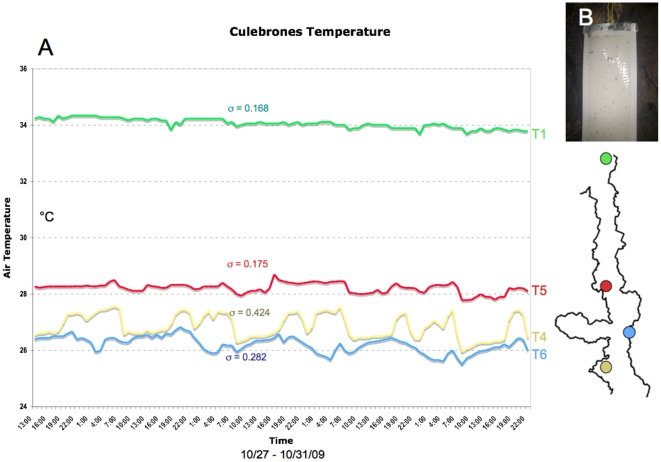
Figure 3. Methods of data capture.
(A) Excerpt of temperature loggers (LogTag, Haxo 8), for 4 measuring points throughout the cave. T1 represents measurements in the main roost (room III); T4, and 6, are placed in the entrance area of room I; T5 represents the measurements on the pupal field (as per cave outline on the right). Graph was modified from Dittmar and Mayberry [46]. Standard deviations are shown for each logger. (B) Overview of a glue board, placed on the pupal field. Dark spots are captured bat flies.

