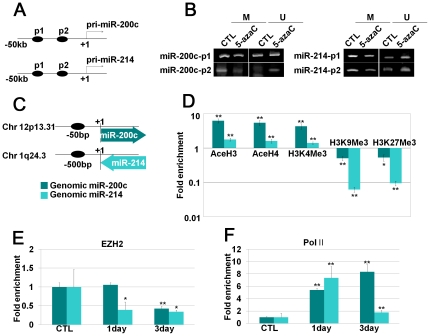
Figure 7. DNMT inhibition modified histone marks, transcriptional enzymes as well as the CpG island methylation status in the vicinity of miR-200c and 214 genomic regions.
(a–b) After treatment with 5-AzaC for 5 days, methyl-specific PCR was performed. (a) Schematic diagrams indicate locations of each primer in the vicinity of miR-200c and -214 genomic regions. (b) Methyl-specific PCR was performed as described in the Materials and Methods section. M: methyl primer, U: unmethyl primer. (c–f) After treatment with 5-AzaC for 3 days, ChIP analysis was performed using antibodies targeting to the indicated proteins (AcetylH3, AcetylH4, H3K4Me3, H3K9Me3, H3K27Me3, PolII and EZH2). (c) Schematic diagrams indicate the locations of each primer on genomic DNA. (d–f) Fold enrichment of indicated proteins in the vicinity of miR-200c and -214 genomic regions were investigated by real-time qPCR.

