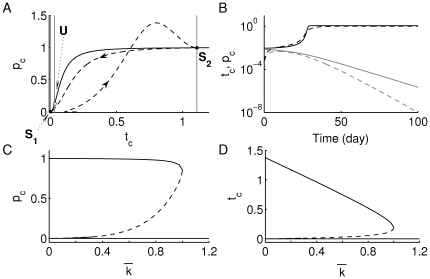
Figure 2. Increasing T-cell avidity (decreasing  ) induces bistability.
(A) The phase plane of the scaled version of system (2a)–(2b) (see Supplementary Material S1), displaying the  - and
- and  -nullclines for
  (i.e. for a high level of T-cell avidity). The three vertical gray lines are the
  -nullclines, while the Hill-like black line is the
  -nullcline. Stable steady states
  and
and  are shown as black dots, while the unstable steady state
  is shown as a white dot. The dashed line traces the time-dependent level of T and plasma cells obtained from the scaled version of full one-clone model (1a)–(1f) superimposed on this phase plane (the arrow-heads represent the direction of flow). (B) The time evolution of
  (solid) and
  (dashed), approaching the autoimmune (black) and healthy (gray) states, depend on the initial level of T cells (
 ). The bifurcation diagrams of (C)
  , and (D)
  with respect to
  are shown displaying the stable steady states
  and
and  in solid lines and the unstable steady state
  in a dashed line. As demonstrated in Supplementary Material S1, bistability is only observed for
  , while at
  ,
,  and
and  merge together at a saddle node bifurcation point, leaving the healthy state
  to become a global attractor for
  (i.e. for a low level of T-cell avidity).

