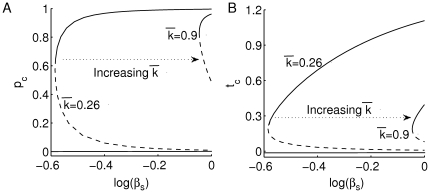
Figure 3. Effects of declining beta-cell number on T- and plasma-cell population sizes.
Bifurcation diagrams of (A)  and (B)
  with respect to the parameter
  according to the scaled version of system (2a)–(2b) (see Supplementary Material S1) at various levels of T-cell avidity (
 and 0.9), are shown. As in Fig. 2, stable steady states are in solid lines and unstable steady states are in dashed lines. At high T-cell avidity, the range of bistability is large, but the decline in beta-cell number leads to a decrease in T-cell population size.

