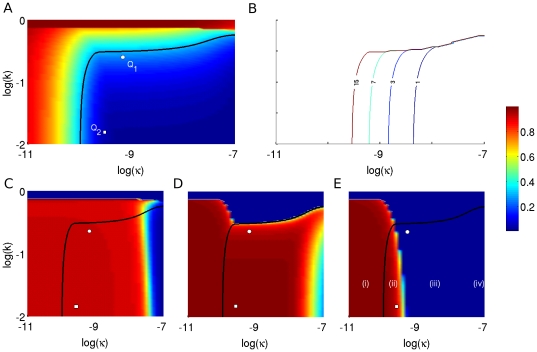
Figure 4. Dependence of T1D disease onset and autoantibody predictability on T-cell avidity and killing efficacy.
The simulations here have been generated using the scaled version of the full one-clone model (1a)–(f) (see Supplementary Material S1). Colour represents the level of (A) beta cells, and (C–E) autoantibodies according to the colour-bar on the right. All axes are in logarithmic scale. (A) The steady state level of  after an autoimmune assault by CD8
 and/or CD4
 T cells. The black line corresponds to 30% of beta cells remaining (citical threshold). It forms the border line between clinically diagnosed T1D cases from non-diabetic cases. When the level of T-cell avidity is low enough (high
  value, dark red region), beta cells remain safe from an autoimmune attack regardless of T-cell killing efficacy. (B) Duration between the emergence of an elevated level of islet-specific autoreactive effector T cells and disease onset (measured in years). Five curves corresponding to 1, 3, 7 and 15 years for disease onset are identified. (C–E) The level of autoantibodies after 6 months of possessing elevated level of T cells (C), at disease onset (D) and at steady state (E) are shown. Four parameter regimes in the
  -space are identified from these panels (highlighted in panel (E)): A regime corresponding to (i) possessing elevated level of autoantibodies throughout without reaching diagnostic T1D; (ii) possessing elevated level of autoantibodies throughout and reaching diagnostic T1D; (iii) possessing elevated level of autoantibodies until disease onset; and (iv) never possessing elevated level of autoantibodies but still developing T1D. The white circle (
 ) and square (
 ) in panels (A), (C–E) correspond to the parameter choices made for
  and
and  in Figs. 5 and 7.

