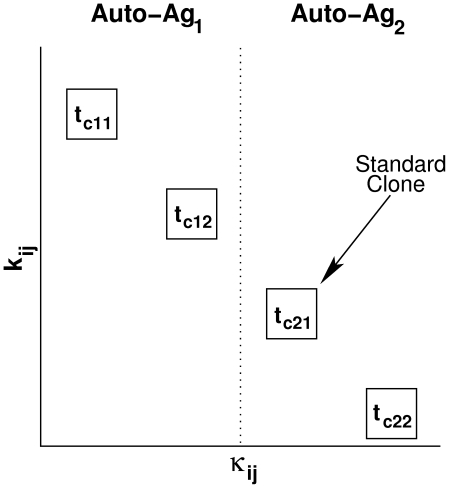
Figure 6. Scheme comparing T-cell avidity, killing efficacy and protein specificity of each subclone under consideration.
The vertical and horizontal axes correspond to the reciprocal of T-cell avidity ( ) and T-cell killing efficacy (
 ), respectively. Auto-Ag
 and Auto-Ag
 are two islet-specific autoantigens. As shown, the two Auto-Ag
 -reactive T-cell subclones (in their scaled form), t
 and t
and t , are more avid and more efficacious in killing beta cells than the two Auto-Ag
 -reactive T-cell subclones t
 and t
and t (in their scaled form).

