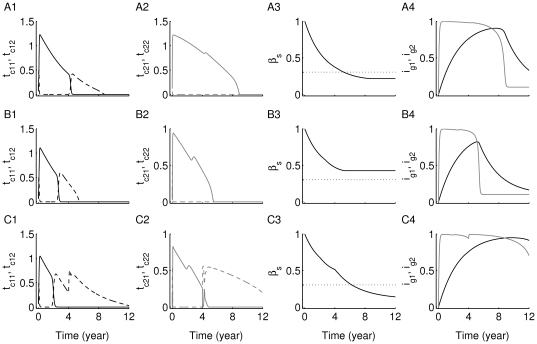
Figure 7. Time evolution of two competing clones of T cells with different antigenic-specificities.
The simulations here have been generated using the scaled version of the two-clone model (3a)–(3g) (see Supplementary Material S1). The scaled levels of (A1–C1) the two low-avidity Auto-Ag -specific subclones:
  (black/solid) and
  (black/dashed); (A2–C2) the two high-avidity Auto-Ag
 -specific subclones:
  (gray/solid) and
  (gray/dashed); (A3–C3) beta cells
  (black solid); and (A4–C4) immunoglobulin specific to: Auto-Ag
 ,
,  (black), and auto-Ag
 ,
,  (gray), are shown. Dotted lines in panels (A3–C3) correspond to the 30% critical beta-cell number (threshold) required for preventing clinical symptoms of T1D (staying insulin-independent). Model responses to variations in the value of
  (while keeping
  ,
,  and
and  fixed) are simulated to determine the effects of the lower avidity Auto-Ag
 -specific subclone,
  , on disease progression. In the upper panels (A1–A4)
  ; in the middle panels (B1–B4)
  ; and in the lower panels (C1–C4)
  . The subclone
  in panel (A2) has the same parameter values as the “standard clone” used in Fig. 5 (white circle). Notice that the levels of autoantibodies, shown in panels (A4–C4), corresponding to the higher avidity Auto-Ag
 -specific subclones (gray lines), become detectable earlier than those corresponding to the lower avidity Auto-Ag
 -specific subclones (black lines). Also, decreasing the level of avidity of
  alone in the bottom row (C1–C4), increases the level of beta-cell destruction by reaching steady state level below the 30% threshold (panel (C3)).

