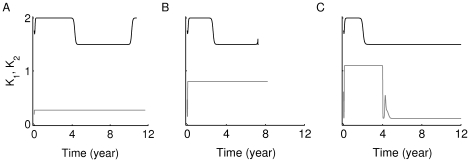
Figure 9. Avidity maturation of the two main clones of T cells considered in Fig. 7.
Each clone is reactive to a given autoantigen (either Auto-Ag or Auto-Ag
 , respectively). The average of the reciprocal of avidity,
  , is measured for
  (black) and
  (gray) (
 ) for 12 years using the time evolutions of the four subclones in Fig. 7. Here, panel (A) corresponds to the upper panels (A1–A4) of Fig. 7, (B) corresponds to the middle panels (B1–B4) and (C) corresponds to the bottom panels (C1–C4). The eventual decay of the quantity
  , associated with the two subclones
  and
and  , shown in gray in panel (C), to a steady state level lower than the ones reached in panels (A) and (B), indicates increased average avidity relative to (A) and (B), and thus worse impact on beta cells, as demonstrated in panel (C3) of Fig. 7.

