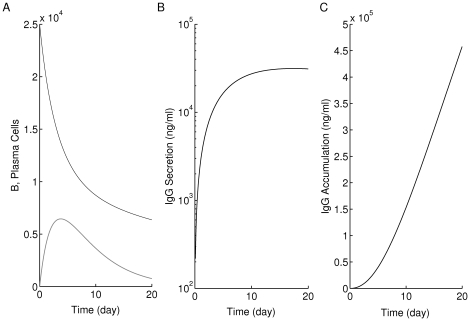
Figure 10. Curve-fitting of B-cell maturation into plasma cells and immunoglobulin (autoantibody) secretion/accumulation.
B cells were co-cultured at a density of 25,000 cells/well with  CD3
CD3 T cells, then IgG secretion rate and accumulation were measured from these cultures [58]. Curve-fitting is applied on (A) the number of B cells remaining (black) and newly formed plasma cells (gray); (B) IgG secretion (vertical axis is in logarithmic scale); and (C) IgG accumulation.

