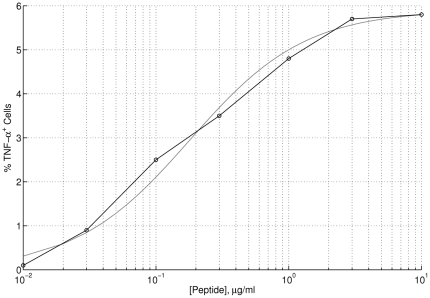
Figure 11. Curve-fitting of T-cell response to autoantigenic stimulation with a given peptide (PPI ).
).
The percentage of CD8 T cells (1E6 clone) staining for intracellular TNF-
 in response to (HLA-A2
 ) PBMCs pulsed with varying concentrations of peptide was measured in [43] (black line). This dose-dependent behaviour was fitted to a Hill function (gray line) with a Hill coefficient of
  . The estimated value obtained for the level of peptide required for 50%-maximum T-cell activation was
 g/ml.
g/ml.

