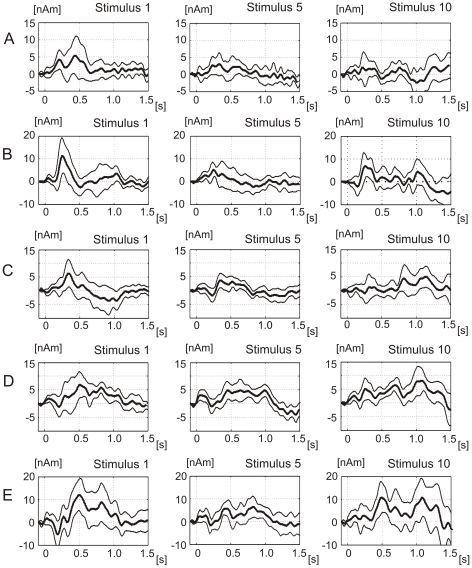
Figure 3. Source waveforms in five source dipoles during stimulus 1, 5 and 10.
The plots show the average (N = 11) source waveforms and the 95% confidence intervals for three of ten laser stimuli. A. The occipital cortex source (dipole 1 in Figure 2). B. The cerebellar source dipole 2. C. The posterior cingulate source dipole 3. D. The left operculo-insular source dipole 4. E. The right operculo-insular source dipole 5.

