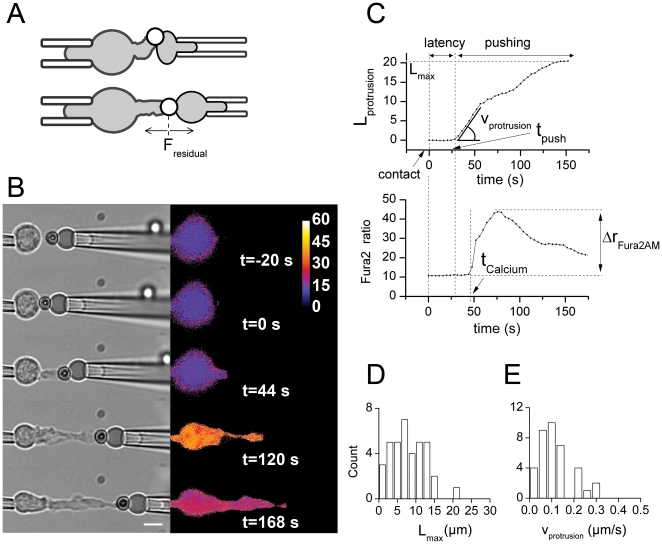
Figure 2. Characterization of the CD3-induced pushing phase.
(A) The dynamic probe-protocol used to measure T cell protrusion growth consists in stepping back the right pipette along the x-axis as soon as a RBC compression is detected (above), in order to relax this compression (below). The residual force exerted on the T cell protrusion after stepping back the pipette, Fresidual , is kept below 25 pN. (B) Representative experiment (Movie S3) using the dynamic-probe protocol (Left: brightfield images; Right: fura2 ratio). Bar is 5 µm. (C) Above: Protrusion length Lprotrusion versus time. During the latency phase, Lprotrusion is constant and equal to 0. The pushing phase starts at t = tpush, when Lprotrusion starts increasing with time. Lprotrusion increases initially at a constant velocity vprotrusion. The protrusion reached a maximal length Lmax. Below: fura2 ratio versus time. The ratio increases abruptly at t = tCalcium>tpush, with a maximal amplitude Δrfura2 relative to the base level. (D) Distribution of Lmax over N = 37 cells. Lmax = 8.2+/−0.7 µm. (E) Distribution of vprotrusion over N = 37 cells. vprotrusion = 0.12+/−0.01 µm/s.

