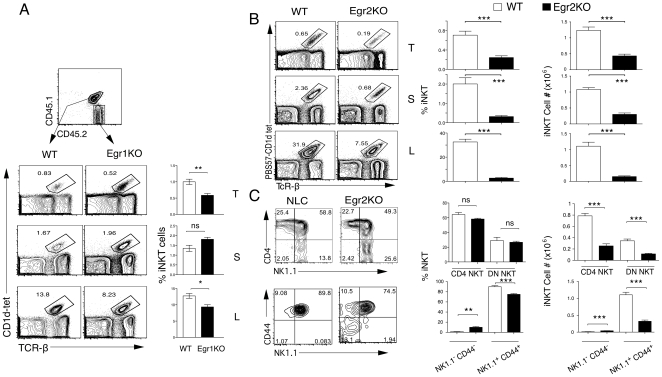
Figure 2. Egr1 and Egr2 contribute in a quantitatively different manner to iNKT cell development.
(a) Contribution of WT and Egr1-/- (Egr1KO) cells to the iNKT compartment in thymus (T), spleen (S) and liver (L) of mixed bone marrow chimeras generated by injecting Egr1-/- (CD45.2) and F1(C57BL/6xB6-LY5.2/Cr) (CD45.1;CD45.2) bone marrow cells into lethally irradiated B6-LY5.2/Cr recipient mice (CD45.1). Mean and SEM is shown on the right (n = 5). Significance was assessed using a paired t-test. **<0.01, *<0.05. This is one out of two independent experiments. (b) Percentages and absolute numbers of iNKT cells in the thymus (T), spleen (S) and liver mononuclear cells (L) of WT and Egr-2f/f-lck-Cre (EGR2KO) mice stained with CD4, CD8, PBS57-loaded CD1d tetramer and TCRβ. (c) Percentages and absolute numbers of iNKT cell subpopulations in gated TCR-βhiPBS57-CD1dtet+ thymocytes from WT and EGR2KO mice. Results representative of five independent pairs in three independent experiments. The bar graphs show the average and SEM of all the experiments. Significance was assessed using an unpaired t-test. ***<0.001, **<0.01.

